 Debugger Debugger |
Without a doubt one of the most appreciated features in a programming tool is the source code debugger.
In some xHarbour based programming tools, the debugger runs in a text based console window, in other tools simply there's no debugger, but Xailer comes with a powerful Windows based debugger fully configurable and with a bunch of useful features, you can launch it from the IDE to fast squash those annoying programming bugs.
Xailer's debugger is activated from the project properties dialog, just click in the Debug info check box, as shown in the right image.
|
 |
The debugger is controlled from the Xailer's IDE main menu, the frist thing you have to do, is to stablish the "break points".
A break point is one line of the source code where the program has to stop in order to review the general behave of variables, objects and databases up to such line.

|
The debugger has "inspectors" to review the state of your running application, these inspectors are: The variables inspector, the workareas inspector, the callstack inspector and the SET values inspector.
|

|
Once stablished the break points, just run your program inside the IDE, when the execution reaches a line where a break point exist, the program will stop, no matter if the application is modal, non modal, a single form or MDI.
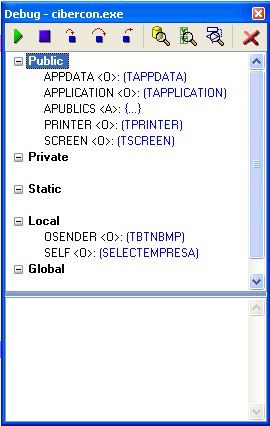
When the program execution stops, the source code editor is shown, along with the debugger control window, which seems like the one shown in the left image.
The debugger control window allows you to perform several tasks for example, you can run your application line by line and at the same time you will see the variable values changing as you go executing every source code line, you can even change the value of these variables at run time.
If your current programming tool doesn't have a debugger, and you are used to use the MsgInfo() function, Xailer has a feature like that, just more elegant, you see... Xailer provides of an empty blank space at the bottom of the debugger control window, this area is called the "debug message area", to display your messages in this area, Xailer has the function OutDebug("message"), you can place this function anywere in your source code, and your messages will be displayed in the message area, just like the MsgInfo() function, this debugging method is ideal for looping operations such DO WHILE and FORs, since it doesn't stop the program execution, just display the messages.
|
The variables inspector is a powerful tool that lets you to review the values of all your variables in different parts of your application, this tool displays the names of the variables along with the values, all the Clipper / xHarbour data types are supported: Local, Private, Public, Static and Global.
If the analized variable is an array, then the variable inspector will show a tree structure with all the values of a single dimension or a bi-dimensional array.
If the variable is an object, the tree structure will be used also to show you all the properties values, if the object contains other objects within, for example when working with forms, these contained objects will be also visibles.
The object inspector also lets you to change the variable values at run time.
|

|

|
Yet another interesting component of Xailer's debugging system is the workareas inspector, which shows you all the "areas" where you have DBF or ADT tables opened.
This inspector provides of valuable information regardig the state of your the opened tables during the program execution, reported data includes information such record number, physical file location, pointer position, etc.
These information also includes the table structure and the current value of all the fields where the database pointer is.
You have access also to index information in any format: CDX, NTX or ADI, displaying also the name of the index file, index key, filtering condition a lot of extra information.
Database editing is also available at run time using the DBU utility included in the Xailer's IDE.
|
Xailer's debugger also has a calls stack inspector, to show you the name of all the the previous processes (functions or class methods) executed before to reach the current break point, this information is useful to know what function or method calls other methods and from which line number every process is launched. |
 |
Xailer's debugger is one of the finest software pieces ever written for xHarbour, other debugging tools work in text-mode only and the ones that work under Windows are so complex that crashes the application at debugging time or simply some programming tools don't have a debugger. |
|

